Oximetry time series analysis
In this tutorial you will learn how to use PhysioZoo OBM to compute the oximetry biomarkers and export the computed values. (link: https://physiozoo.com/)
Introduction
SpO2 is a measure of the amount of oxygen-loaded hemoglobin in the blood, relative to the amount of oxygen-unloaded hemoglobin. The extraction of digital biomarkers from the oxygen saturation time series is a critical step in the process of diagnosis and monitoring of patient pulmonary function. Indeed, studying the variability of the oxygen saturation signal may provide information on the underlying physiological control systems. PhysioZoo OBM provides the framework and the tools for extracting oximetry biomarkers from the SpO2 signal.
Performing oximetry analysis
Start by loading some example data by clicking File -> Open data file -> SpO2/SpO2_example.txt. The program will start the analysis automatically and will display the following window:
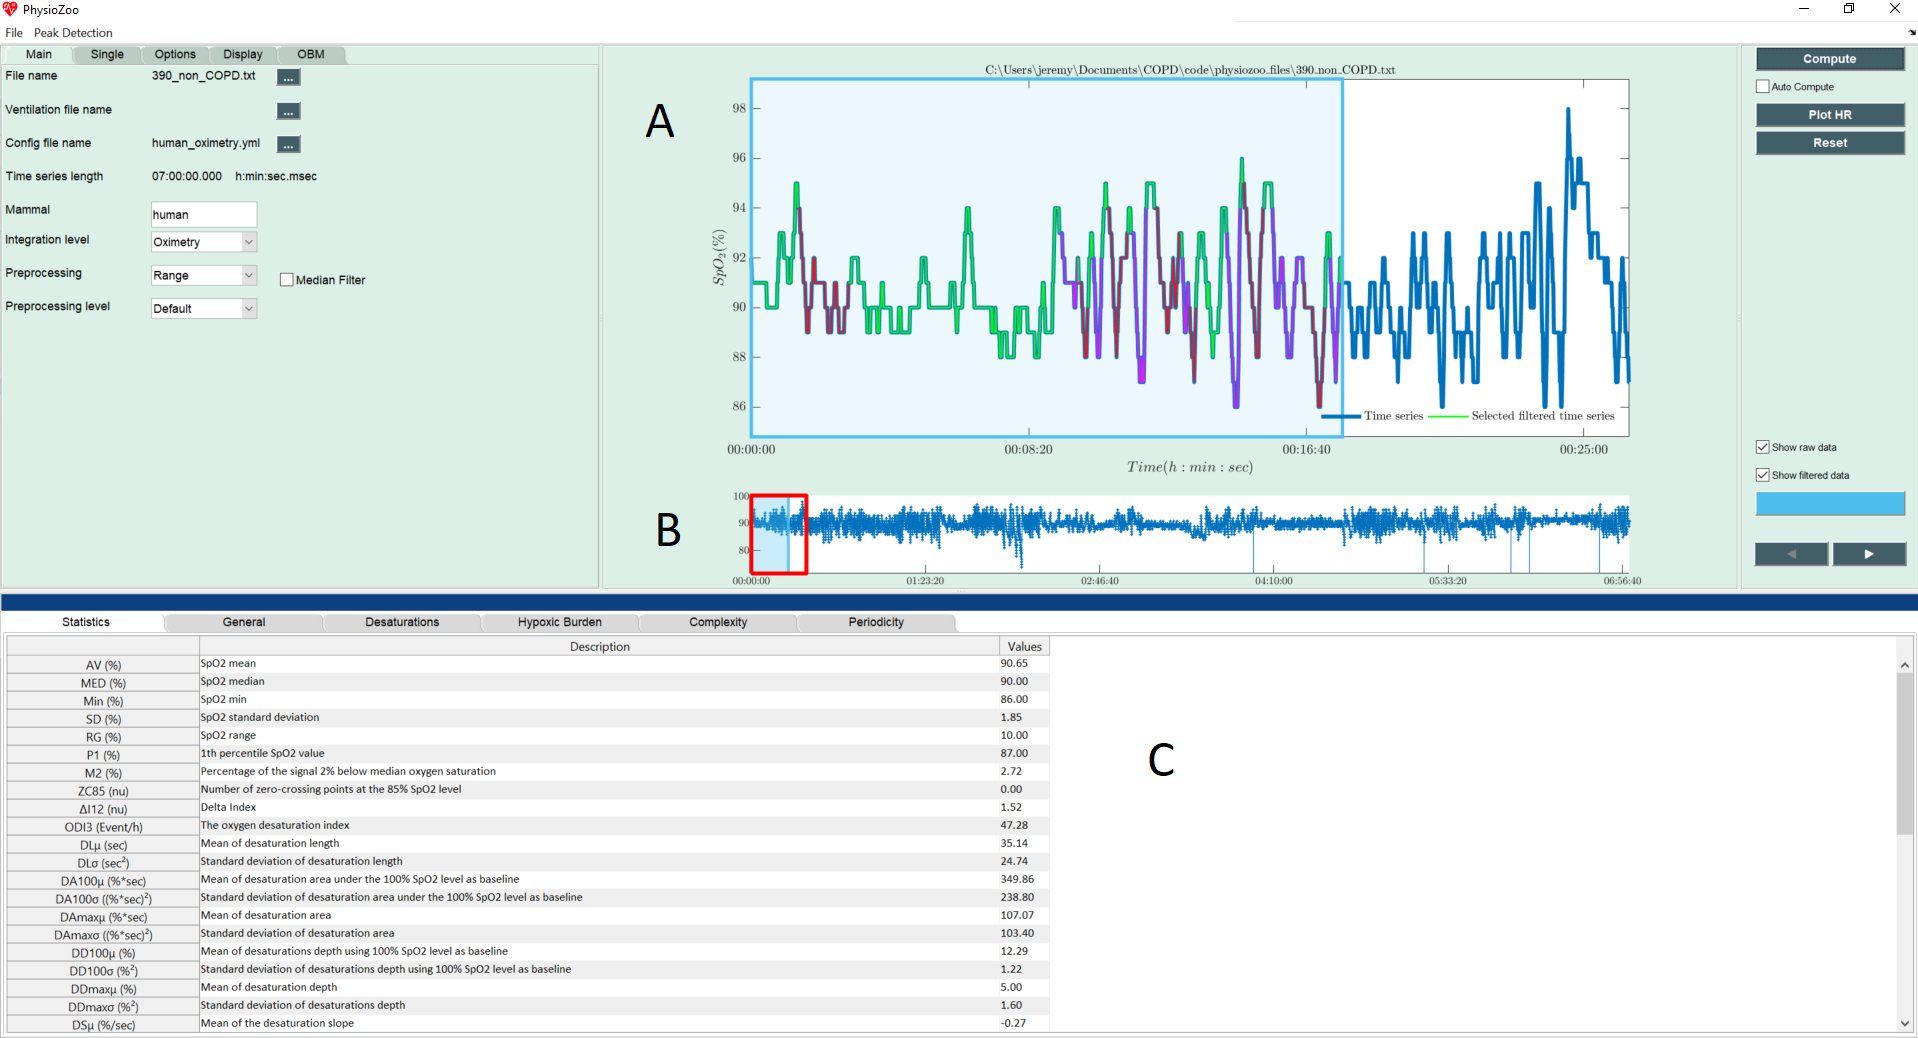
Refering to the figure above: (A) the selected window (shaded in blue) defines the time interval for which the oximetry biomarkers are computed. In the lower panel (B), the overall oximetry signal is plotted. Two windows are drawn on it: one window with a red frame and another one with a blue frame (and alpha color from within). The red window defines the part of the oximetry time series plotted in the larger upper figure (A). The blue frame defines the part of the oximetry time series for which the biomarkers will be computed. The two windows can be modified (extended/shrunk/moved) using the mouse. Pannel (C) shows all the oximetry biomarkers that have been computed.
Congrats! You have made your first oximetry analysis with PhysioZoo OBM! The biomarkers are divided into five different categories: General, Desaturations, Hypoxic Burden, Complexity and Periodicity. You can choose to compute only certain categories (to save time), into the tab “OBM”.
Note
Every time you move the analysis window to another location the newly selected segment will be automatically analyzed. You can disable this by deselecting the checkbox “Auto Compute” located under the “Compute” button.
Note
The length of the selected window is important. Some biomarkers require algorithm with high complexity, and thus may take some time to run on too long windows. You can modify the size of the window under “Display”.
Exporting oximetry biomarkers
You can export the oximetry biomarkers and the prefiltered SpO2 signal generated by PhysioZoo OBM. Go to File -> Save SpO2 measures. The following window will display:
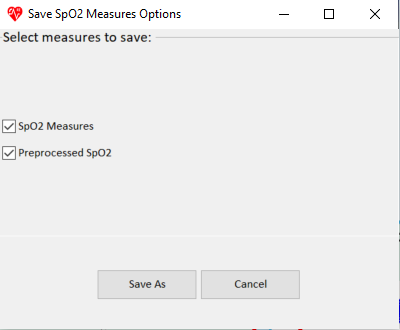
You can select the computation(s) you want to save with the checkboxes:
SpO2 Measures: The 44 oximetry biomarkers computed by the software.
Preprocessed SpO2: the oximetry time series after it was preprocessed by the filter you specified under Main-> Preprocessing.
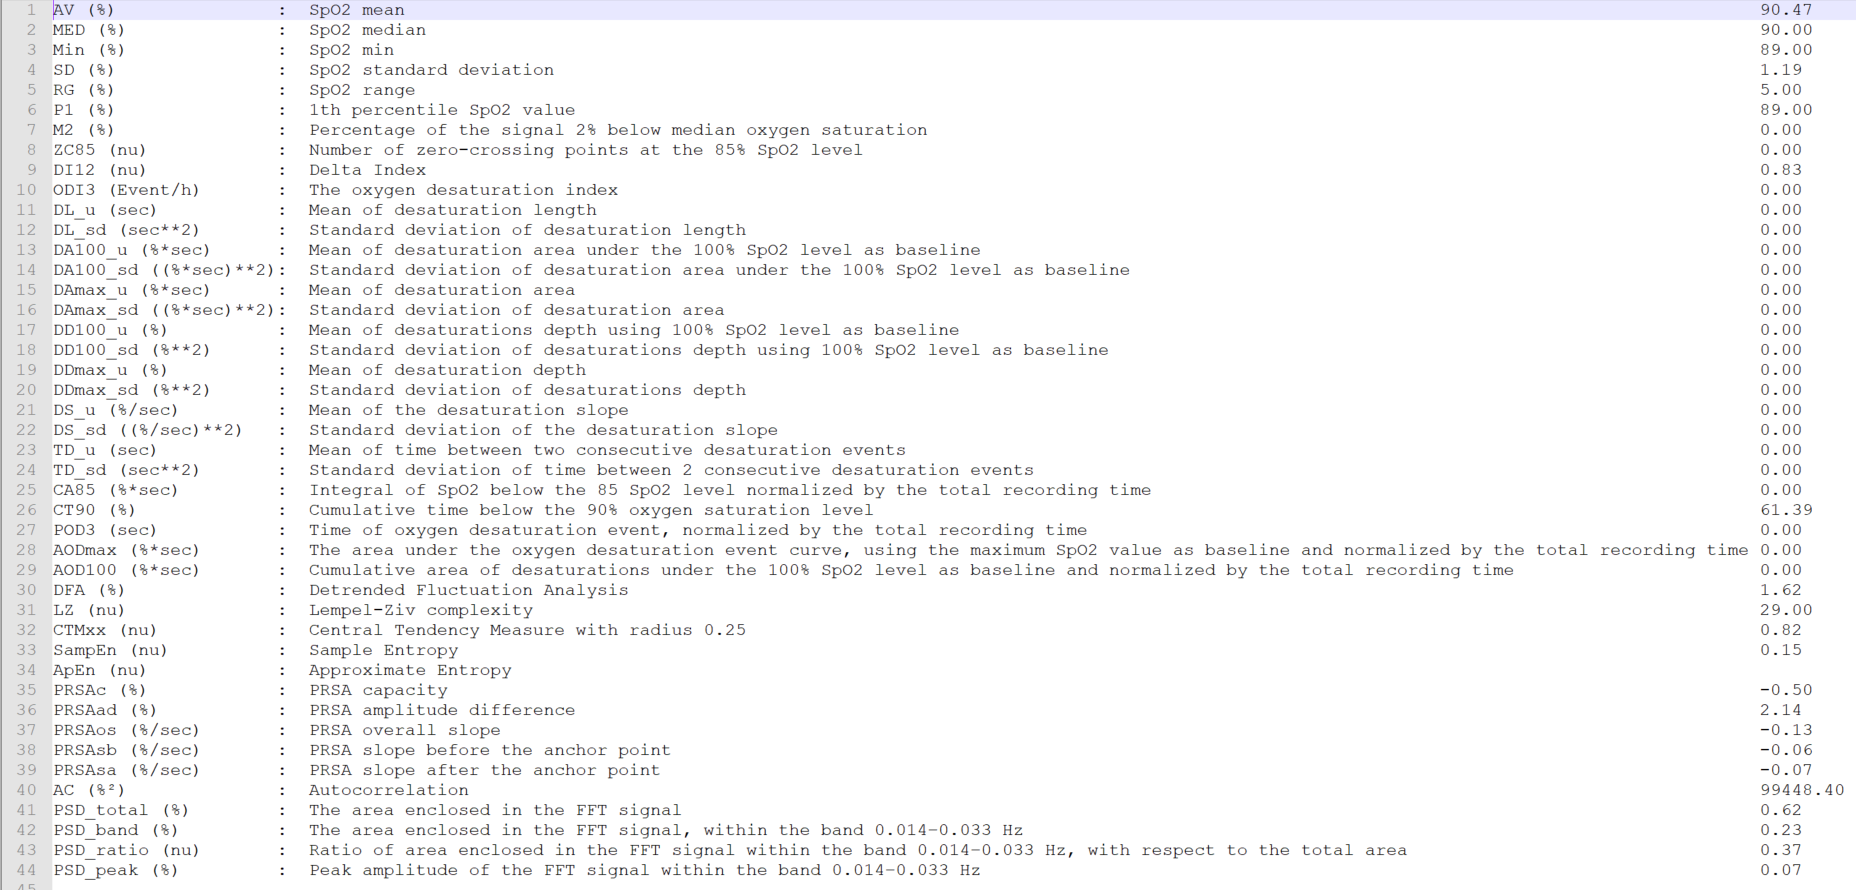
Select the location where you want to save the oximetry measures. Open the file and see the list of oximetry measures together with their definitions and values for the window that was selected.
Exporting figures
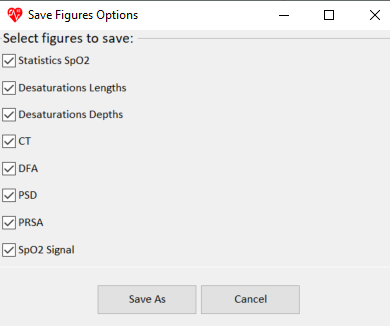
Using PhysioZoo OBM you can export some summary graphs such as the distribution of the time series, histogram of the desaturations characteristics etc. Figures can be exported in high quality format and thus easily included in your research reports and/or papers. For exporting figures click File -> Export figures. You will be prompted with the following window on which you can choose what figures you want to export. After clicking ‘Save As’ you will be able to choose the format of the figure.
Consecutive windows analysis
You might want to track the evolution of the oximetry biomarkers over the time. For example, for monitoring patients it would be useful to see how the oximetry biomarkers vary over time. For that purpose PhysioZoo OBM enables the analysis to be performed on consecutive windows.
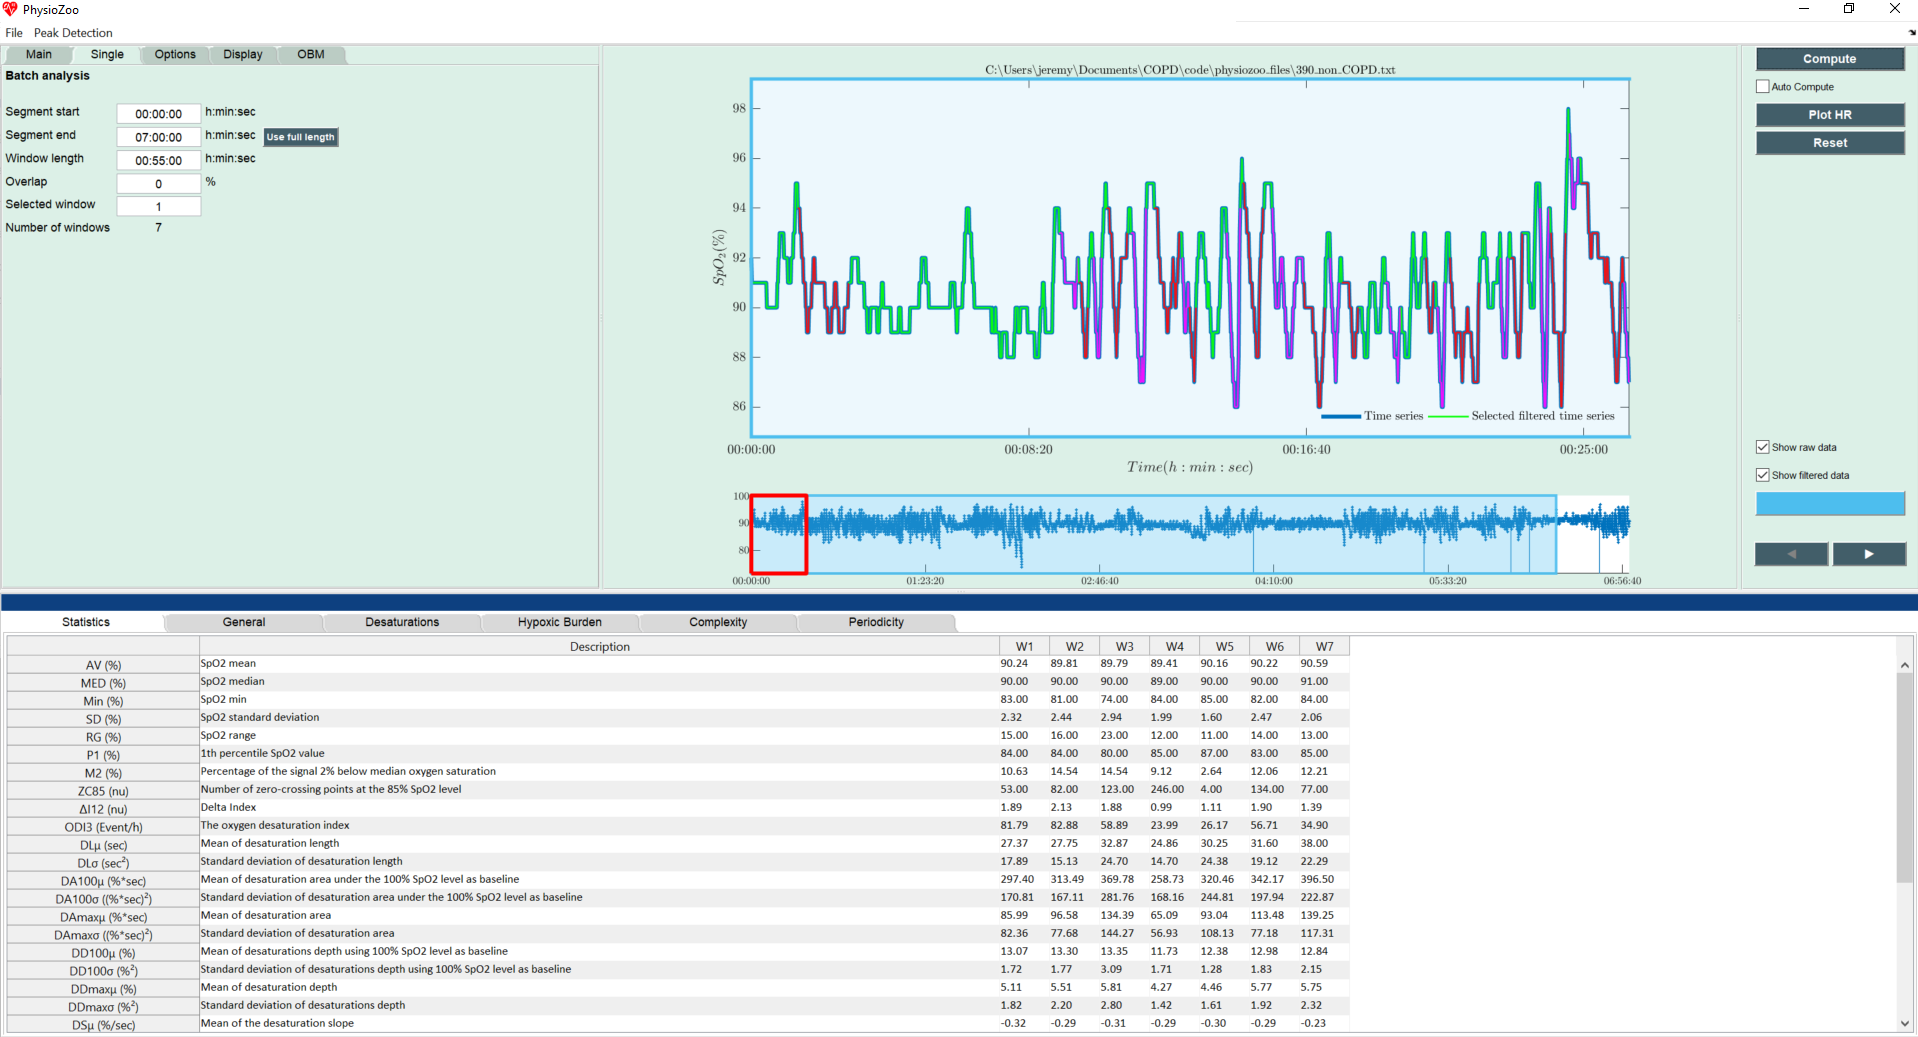
Click the “Single” Submenu in the left panel and click on the “Use full length” button. Then press the “Compute” button located on the top right of the interface. You will see the following screen, which contains all the oximetry biomarkers for each consecutive window over the whole recording.
You can also enable the analysis window to be overlapping by using the “Overlap” entry in the Analysis menu. By default the value is 0% (i.e. no overlap between successive windows). Change it to 50% and re-run the analysis.
You can export all oximetry biomarkers from all consecutive windows (Main -> Save SpO2 measures).
If you want to export figures, then select with the mouse the window you want to save the figures for.
Setting biomarker parameters
The oximetry biomarkers have a number of associated parameters which can be adjusted by the user. For example, desaturations can be detected with a relative threshold of 3% or 5%. In order to change those parameters, click on tab “Options”. Then you have six tabs, one for filtering and one for each of the five categories of biomarkers. After changing the value of a specific parameter, click on “Compute” in order to compute again the biomarkers with the new parameter.